The dashboard shows the trend of the stock value for all active loops* in the license.
The stock level in the various charts reports the units of measure set in the component master data: - The currency used is that of the license, displayed per single day. - The value is based on the statistical cost of the component.
The evaluation of a loop's stock level takes into account the number of full kanbans, minus half the quantity of the kanban in use: this is because the containers are scanned when the last piece is picked, so KanbanBOX considers the kanban in use to be "half full".
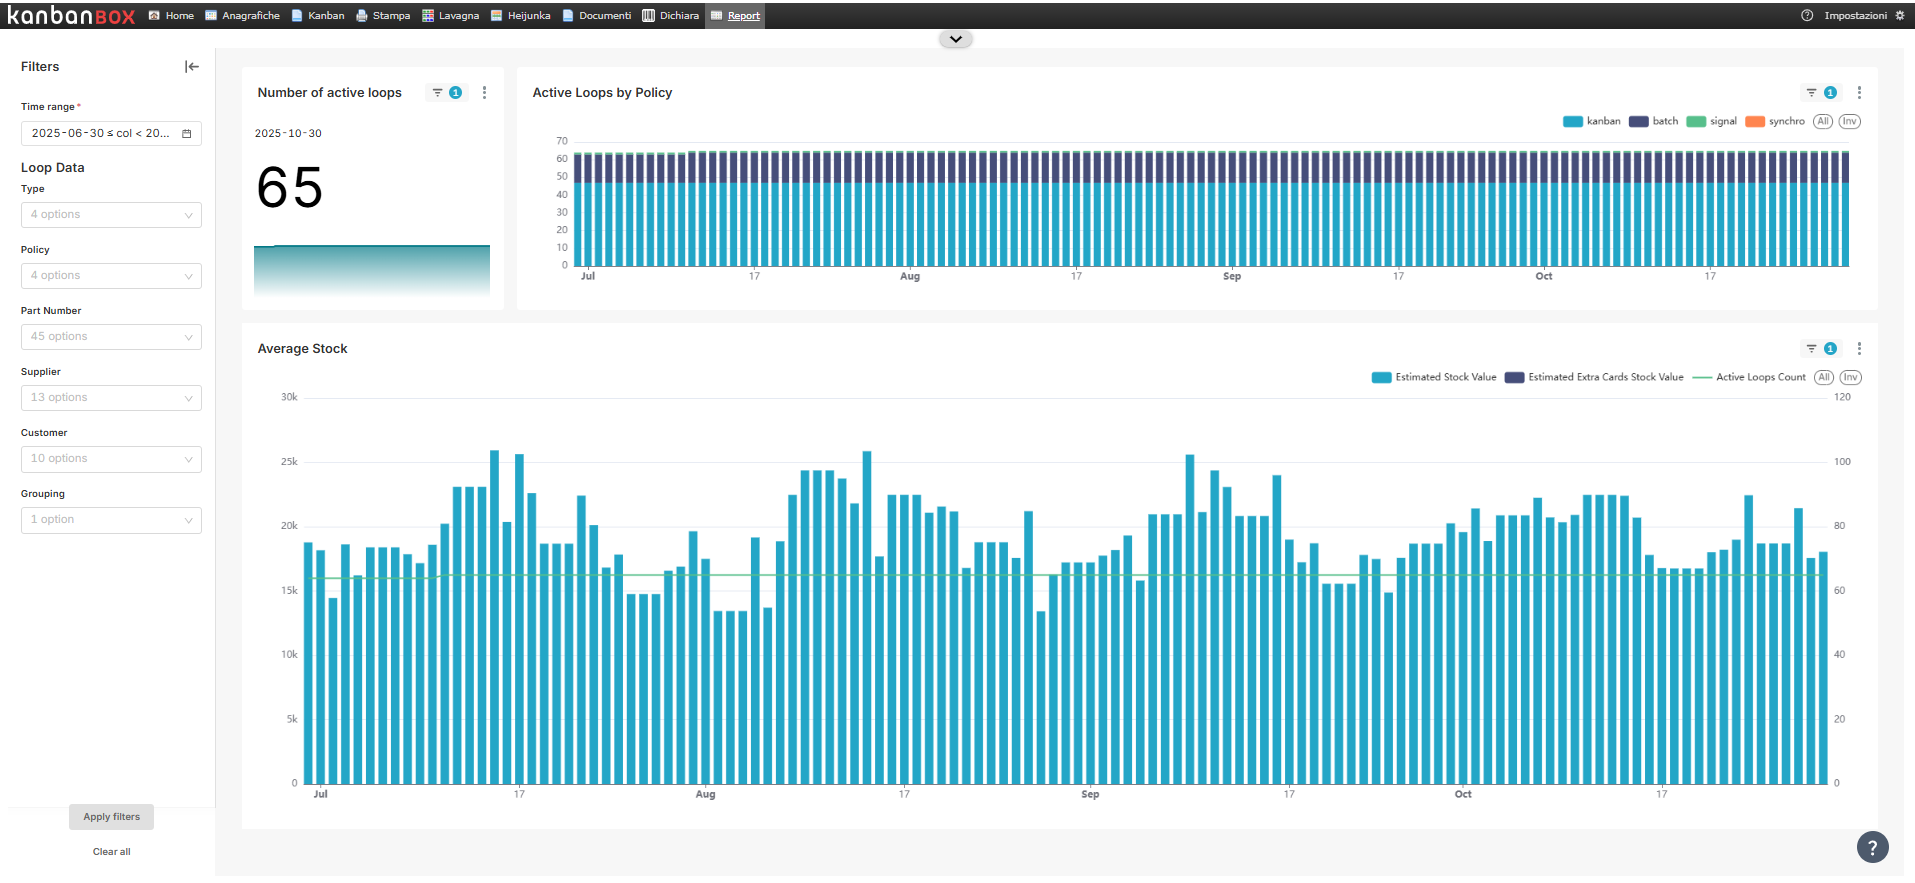
The dashboard is divided into 3 main charts: 1. Number of active kanban loops: indicates the number of active loops in the license at a certain date. The increase is expressed as a percentage, compared to the number of active loops 6 months before the specified date.
-
Active loops by policy: indicates the number of active loops on a certain date, divided by loop policy.
-
Average Stock: indicates the day-by-day trend of stock levels, dividing kanban and synchro loops. The green line within the chart shows the number of active loops on the day the stock levels are calculated.
*A loop is considered active if at least one of its kanban cards is in a status other than "New".
For more information about the dashboard filters, see the article Introduction to Kanban BI.
Comments
0 comments
Please sign in to leave a comment.