The dashboard shows the value of the cards that have been set in "Full" status over a given period of time. It is valued only if the statistical cost is entered at the component master data level.
The dashboard is divided into two sections:
-
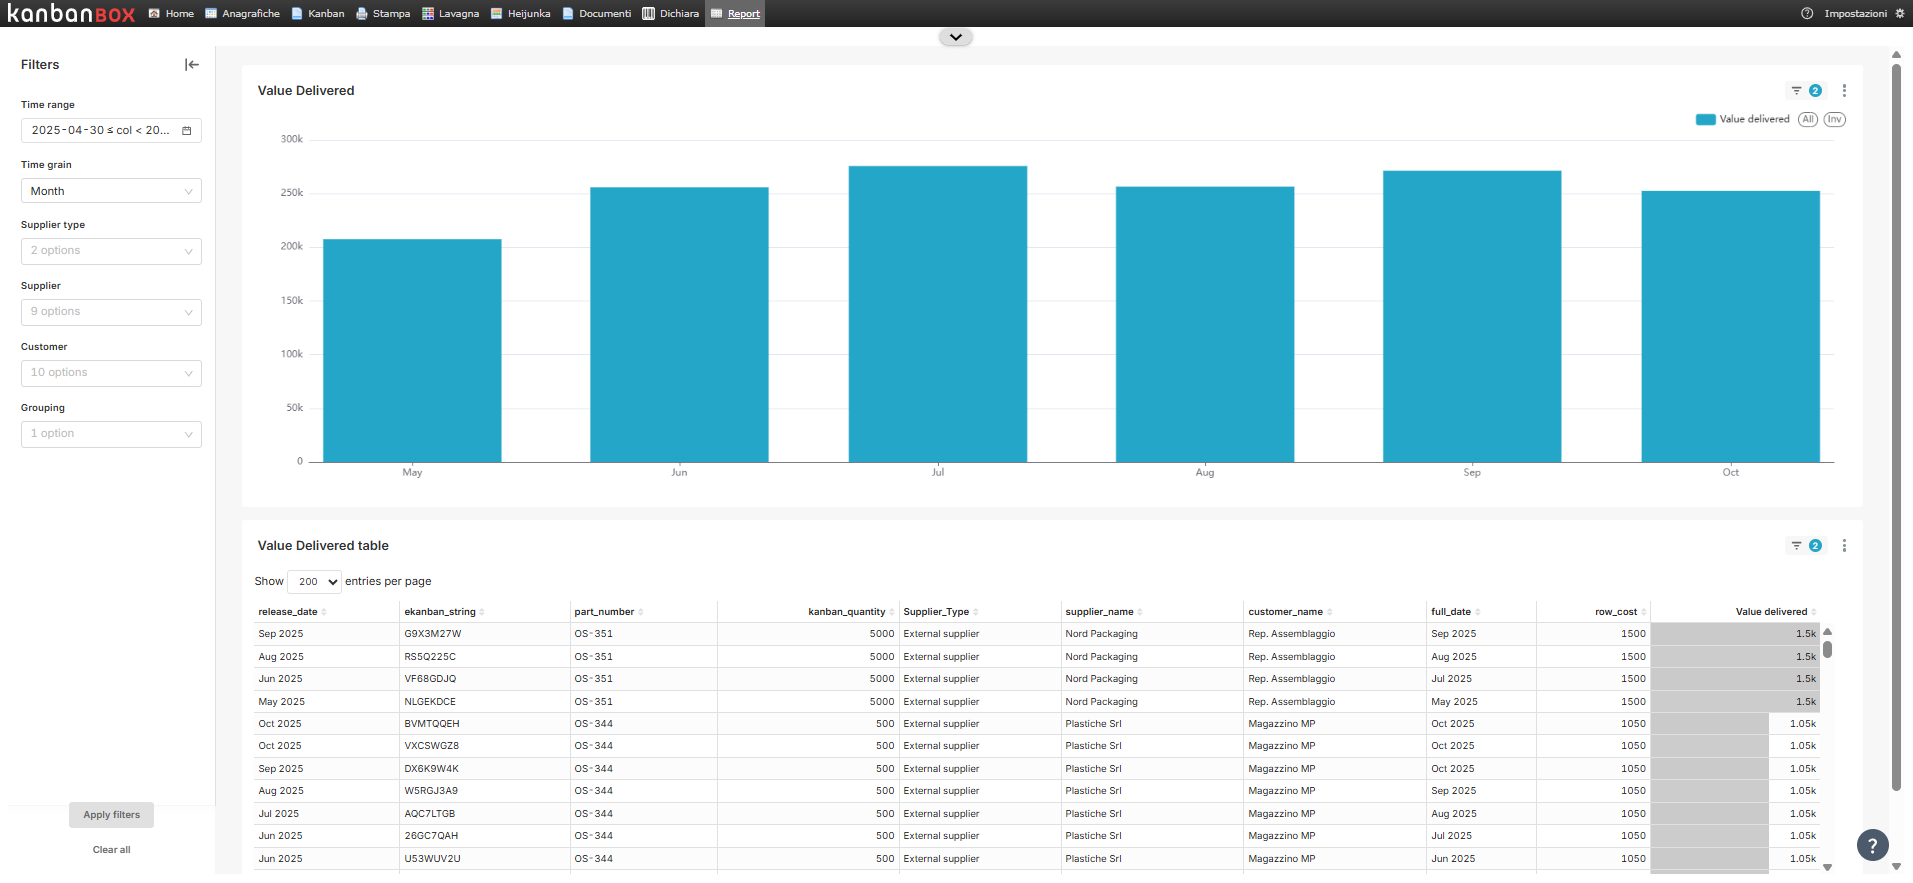
Value Delivered: indicates the value of the cards that have been set in "Full" status over a specific period of time (expressed in the currency set in the license). The data is aggregated based on the "time grain" filter, which allows viewing the delivered value for each month, week, or day.
-
Value Delivered table: indicates the detail of what is displayed in the chart above. In this table, each row represents a card set in "Full" status.
For more information about the dashboard filters, see the article Introduction to Kanban BI.
Comments
0 comments
Please sign in to leave a comment.