The dashboard is dedicated to the analysis of loop maintenance.
It provides guidance on the maintenance to be carried out based on the consumption registered by KanbanBOX. The economic impact and the impact in "number of cards" are indicated if the increase or decrease suggestions proposed by the system were accepted.
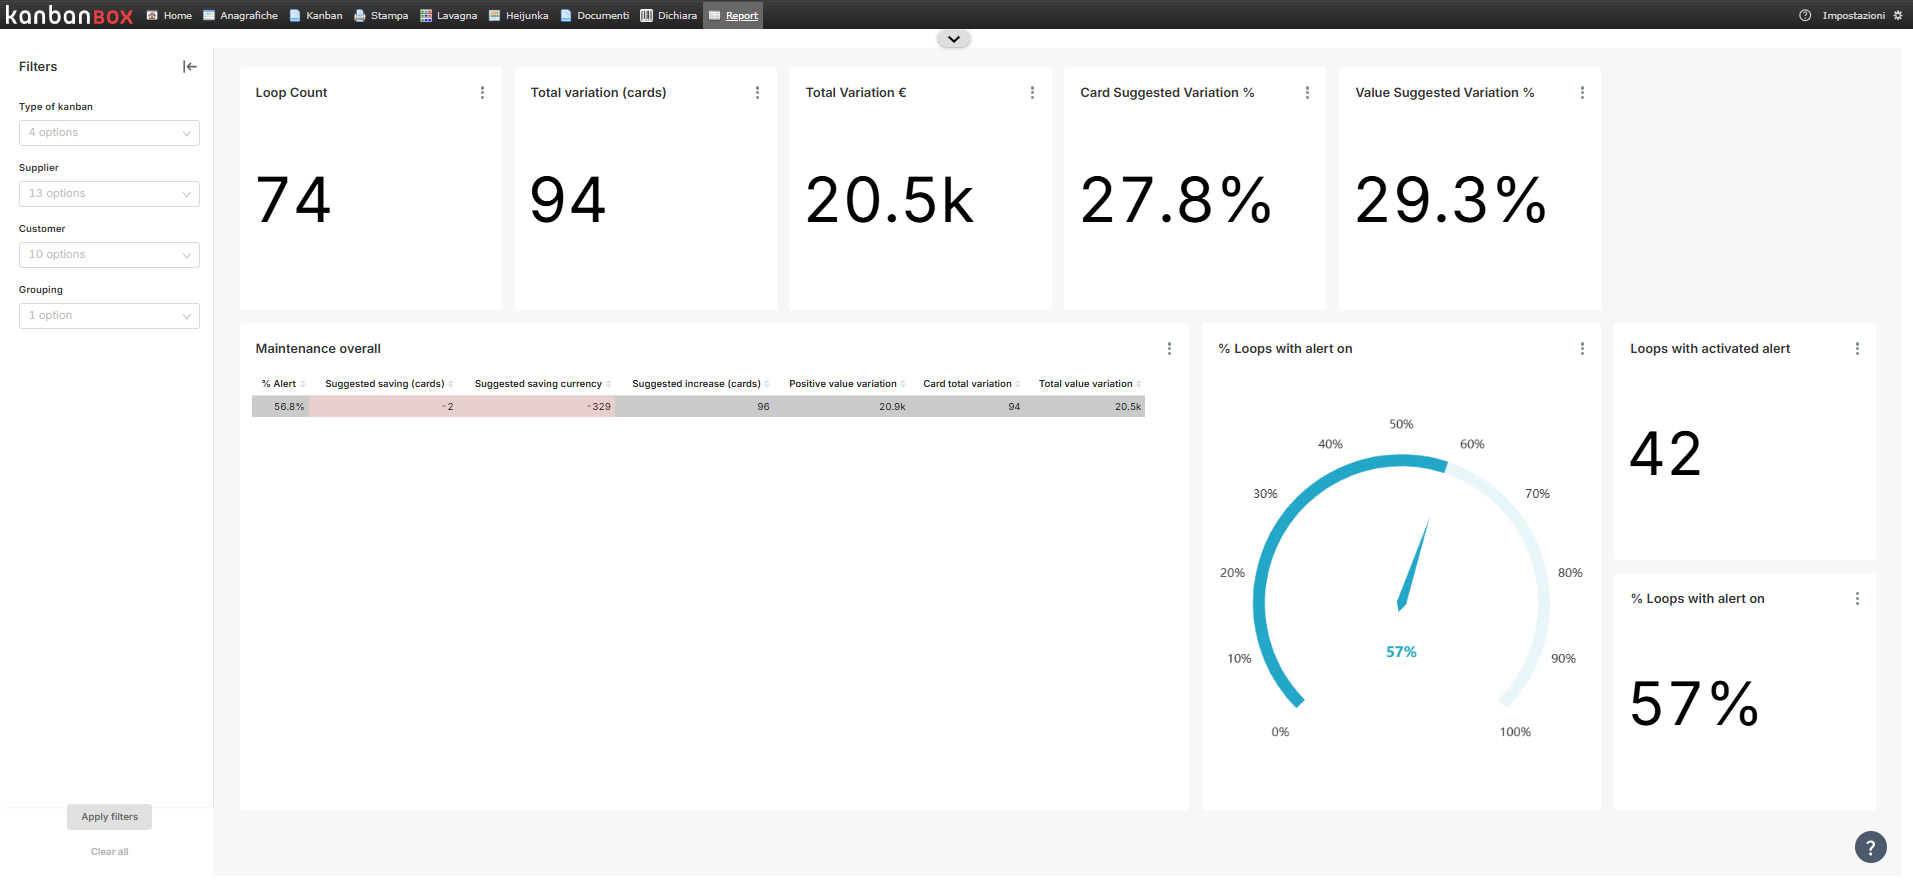
The dashboard is divided into multiple sections:
- Loop Count: indicates the total number of active loops* within the KanbanBOX license.
- Total variation (cards): indicates the absolute variation in the number of cards if the suggestions from KanbanBOX were accepted.
- Total Variation €: indicates the absolute variation in economic terms if the suggestions from KanbanBOX were accepted.
- Cards Suggested Variation %: indicates the percentage variation in terms of number of cards if the suggestions from KanbanBOX were accepted.
- Value Suggested Variation %: indicates the percentage variation in economic terms if the suggestions from KanbanBOX were accepted.
- Maintenance overall: this table aggregates the information contained in the preceding sections.
- Loops with alert on: indicates the number of loops with an active maintenance alert according to the consumption registered in KanbanBOX.
- % Loops with alert on: indicates the percentage of active loops* in the KanbanBOX license with an active maintenance alert.
*A loop is considered active if at least one of its kanban cards is in a different status than "New".
For more information about the dashboard filters, see the article Introduction to Kanban BI.
Comments
0 comments
Please sign in to leave a comment.